1 Description
The goal of any visualisation is to be able to effectively convey insights and reduce cognitive load on the part of the audience to understand these insights.
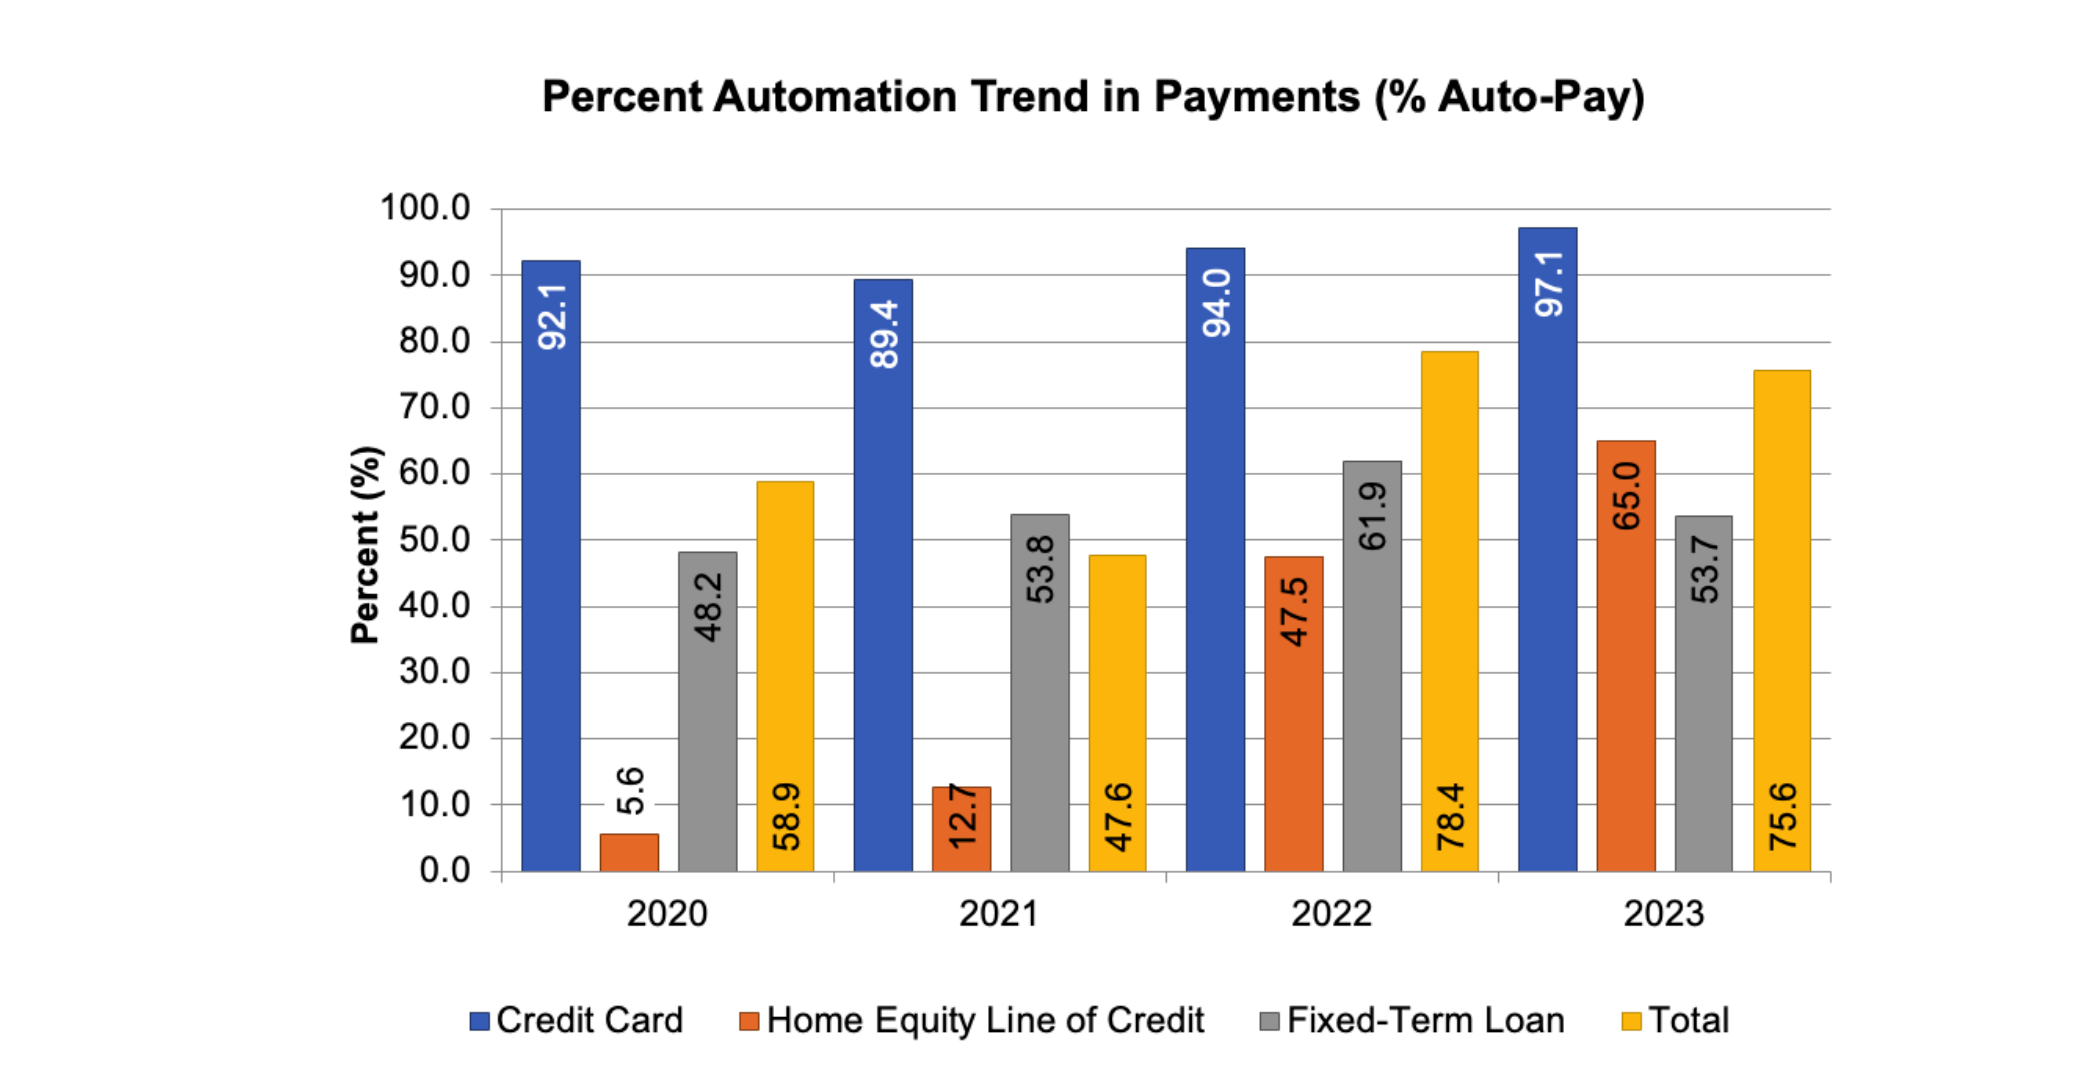
In this challenge by “Storytelling with data”, we are primarily required to eliminate the clutter in the plot as illustrated by Figure 1.
2 Changes proposed to reduce the clutter
The first issue I was able to observe in the graph is that there is too much information in the bar graph and we need to focus on only the key details which can allow us to get better insights without being overwhelmed by all the available data.
Additionally, the percentage values in the plot were overly accurate (upto 1 decimal point) which is not a particular concern when trying to obtain insights from these graphs. Hence, we can round up or down the percentage values, thereby making it easier to compare the two graphs.
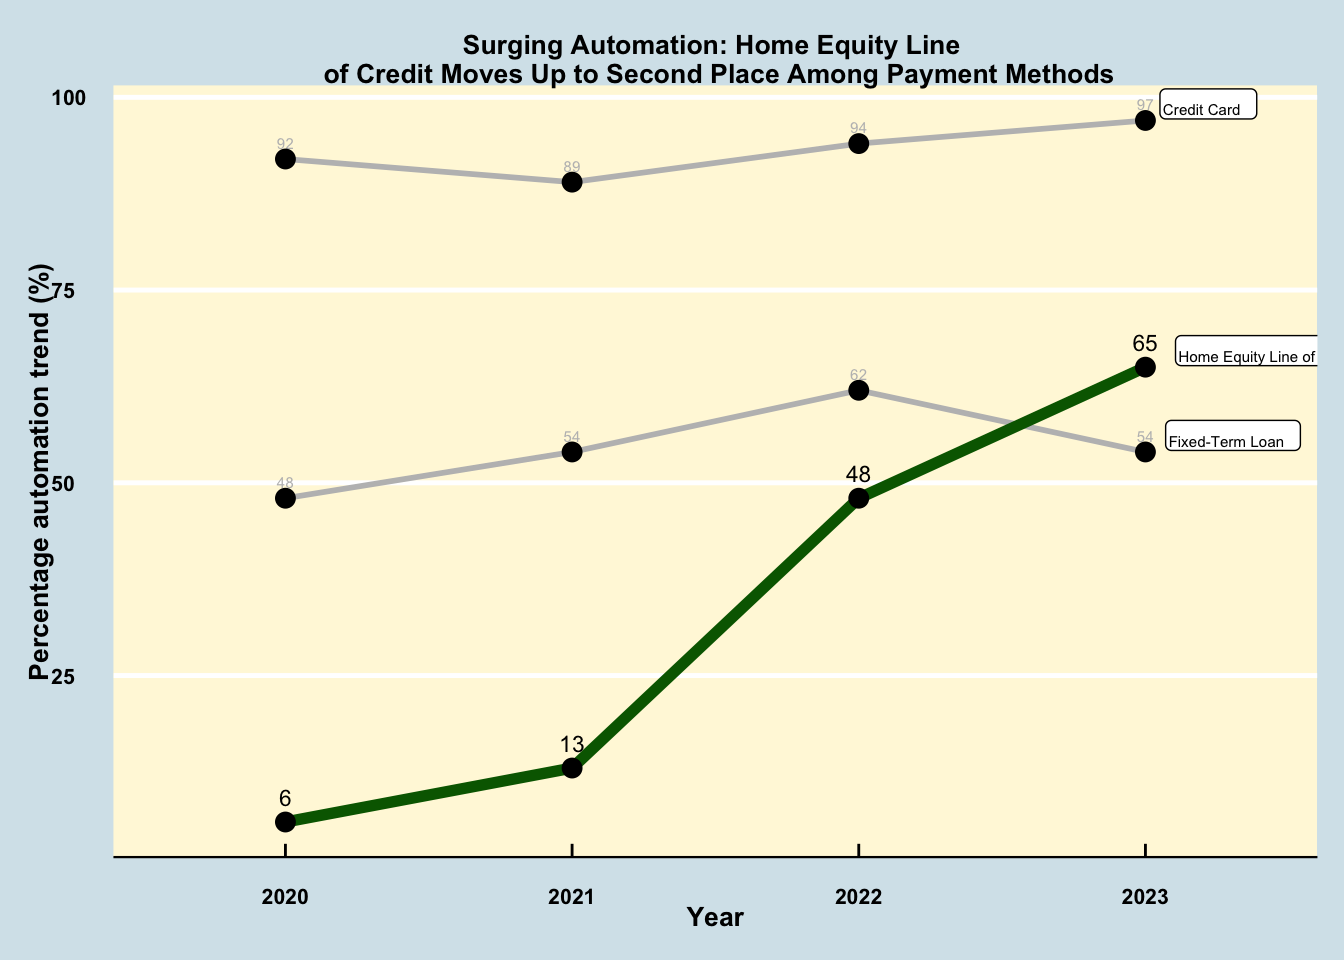
Instead of visualising the data in bars, a better option would be to visualise the data as a line plot as it is easier to observe the trends of automation in the temporal space.
In this plot, it was particularly interesting to observe the rise of automation for home equity line of credits as compared to the other payment methods. Hence, the colour and the text labels for this datapoint was emphasised through a darker colour shade.
An appropriate title was used to emphasise the most interesting aspect of the current data as illustrated by Figure 2.