1 Introduction
This month’s challenge involved utilising a funnel chart to visualise data that typically contains progression information. Each bar in the funnel chart would typically relate to the aggregated data for a particular level, with each progression depicting the aggregations for the subsequent levels. 📈
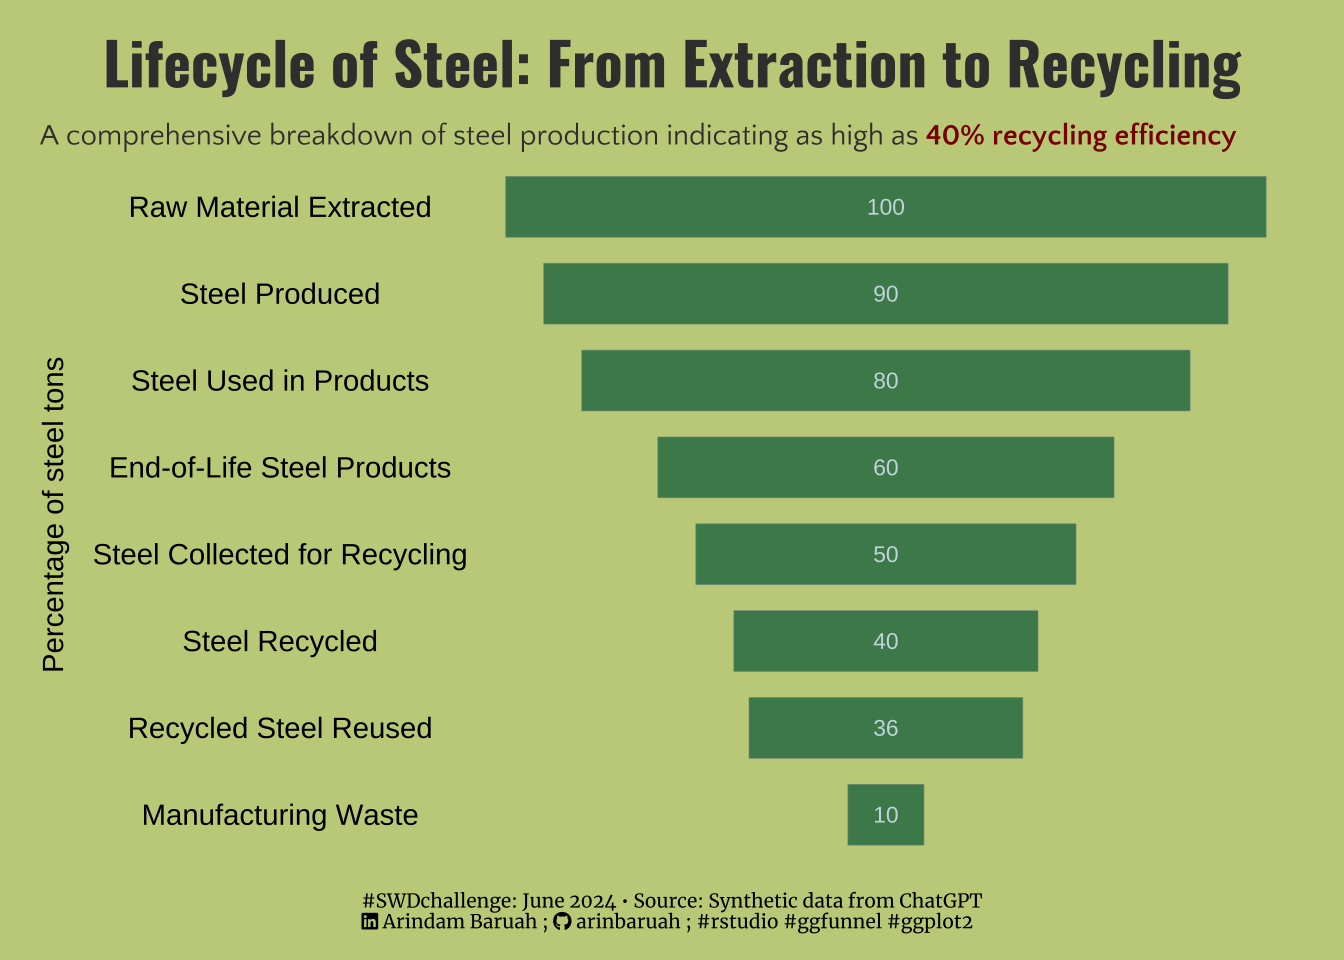
For this challenge, I decided to plot synthetically generated data of a typical steel manufacturing process from GenAI to create a plot that tells us the total tons of iron/steel that are extracted, processed and finally recycled, thereby following a logical progression of the manufacturing process. 🔬
2 Description
Steel production is one of the heaviest contributors to the carbon footprint of any nation. Leading manufacturers of steel such as China and India often have to deal with large-scale effects of sound, water and air pollution associated with the manufacturing of this ferrous metal. Hence, it is quite important to recycle and reuse steel to reduce its harmful effects on the environment.
Steel, while heavily criticised to be a “polluted metal”, is also one that humanity cannot do without. Any major civilian infrastructures, defence products, cars or even home electronic goods have some grade of steel in their construction. Steel is essentially a metal which is highly recyclable as well. Figure 1 illustrates about 40 % of steel in a production process is recycled. Through the use of recycled steel in various steel plants, not only production costs can reduce, but it may also lead to lower tonnage of iron mined, lesser heat and electricity demands at the mills, and lower carbon di-oxide released as a result of iron and steel making.