| Variable | Explained |
|---|---|
| scientificName | The scientific name of the observed species. |
| taxonConceptID | The taxonomy website ID. |
| recordID | The record ID of each observation. |
| dataResourceName | The data resource associated with the observation. |
| occurenceStatus | The occurrence status: Present. |
| eventDate | Recorded sighting date in the format YYYY-MM-DD. |
| decimalLatitude | Latitude value of sighting in decimal format. |
| decimalLongitude | Longitude value of sighting in decimal format. |
| eventTime | Time of the event recorded in the format hh:mm:ss. |
| eventID | The event ID of each observation. |
| eventRemarks | Any additional remarks or comments related to the observation. |
| samplingEffort | The number of nights spent on trapping activities. |
| samplingProtocol | The protocol that was used to sample the species |
1 Introduction
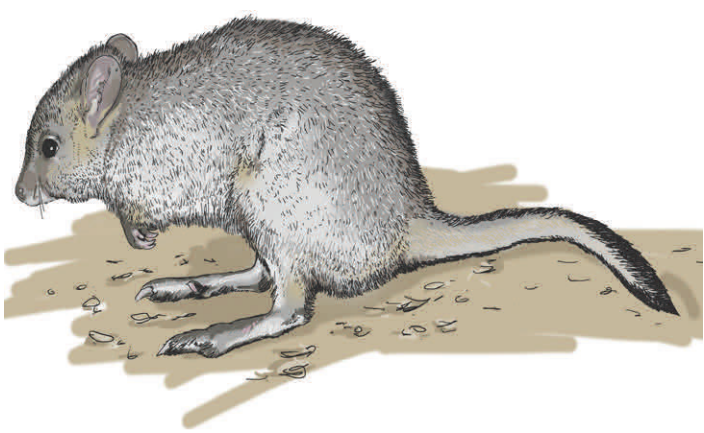
The Brush-Tailed Bettong or Woylie (Bettongia penicillata ogilbyi) is a remarkable Australian marsupial with unique characteristics. It thrives in a diverse range of habitats, including forests, woodlands, and shrublands, where dense vegetation offers shelter and sustenance. This nocturnal creature is most active during the night and rests in leafy grass nests during the day. Unfortunately, the Woylie has faced a perilous decline, with its population plummeting by more than 90% in the past two centuries. This decline can be attributed to various factors, including habitat loss, introduced predators, and disease. Consequently, the Woylie is currently classified as a critically endangered species, receiving protection from the Australian government. Most of the remaining Woylie population resides in wildlife sanctuaries, where they can live free from predators.The allure of encountering unique creatures in the wild has given rise to ecotourism, a sustainable form of tourism that emphasizes personal experiences with nature and promotes conservation. Given the Woylie’s elusive nature, our analysis seeks to understand the relationship between Woylie sightings and tourist visits
Expectations for sightings and weather data
From this data we expect the following results:
- We expect to observe a decline in Woylie occurrences over the past 20 years, reflecting their critically endangered status.
- The dataset is likely to show fewer sightings in the wild over recent years, given that Woylies are mostly found in protected sanctuaries.
- Woylies are expected to have limited sightings near weather stations, as their habitat preferences are specific to certain regions within Australia.
- We anticipate a seasonal pattern in sightings, with more occurrences during specific times of the year, possibly correlating with breeding seasons or favorable climate conditions.
- It is unlikely that there will be a significant number of sightings in urban areas, as Woylies tend to avoid human-populated regions due to habitat disturbance.
In our report we first analyse records from Atlas of Living Australia (ALA) database and check if they match our expectations, we also explore how weather is related to when Woylie sightings occur and find the region with most number of Woylie sightings. Further we perform an analysis that delves into the trends of tourism within that region. With respect to our analysis pertaining to the tourism trends, our expectations are as follows:
Expectations for tourism data
- We expect most of the Woylie sightings to either be in Western or Southern Australia.
- We expect most number of holiday trips to be in September through November or March through May.
- We expect a seasonal holiday pattern in the region of interest which may consequently lead to higher Woylie sightings.
2 Data description
2.1 Species data
To ensure a robust foundation for the analysis, occurrence records of the Brush-Tailed Bettong or Woylie (Bettongia penicillata ogilbyi) were obtained from the Atlas of Living Australia (ALA) database using the functions of the galah R package.
This dataset includes essential information, such as date, time, and collector identification details, and comprises 13 variables and 2,276 observations across Australia as of the current report.
The code to derive the species data can be viewed below and the data dictionary of the variables can be seen in Table 1.
2.2 Tourism data
In addition, to conduct an analysis on ecotourism of the Woylie, tourism data from Tourism Research Australia (TRA) was obtained.
This dataset includes spatial, temporal, and trip information. It comprises 4 variables and 1,228,000 observations covering Quarter 1 of 1998 to Quarter 4 of 2022 across all Australian Statistical Area Level 2 (SA2) regions of Australia.
The data dictionary of the variables can be seen in Table 2.
| Variable | Explained |
|---|---|
| Quarter | The year and quarter of the observation in the format YYYY Q, e.g., Q1, Q2, Q3, or Q4. |
| Region | The Australian Statistical Area Level 2 (SA2) region of the observation. |
| Purpose | The purpose of the trip, categorised as Holiday, Visiting friends and relatives, Business, or Other reason. |
| Trips | The total number of trips in thousands ('000). |
3 Initial data analysis
3.1 Species data
In preparation for the forthcoming analysis, an Initial Data Analysis (IDA) was conducted on the species data. This involved removing a few unnecessary columns and systematically saving only the wild sightings, as the analysis focuses on the natural wild habitat and behavior of the species.
After reducing the dataset, variable types and missing values were checked, as depicted in Figure 2. There were no missing values that were significantly of interest or required cleaning.
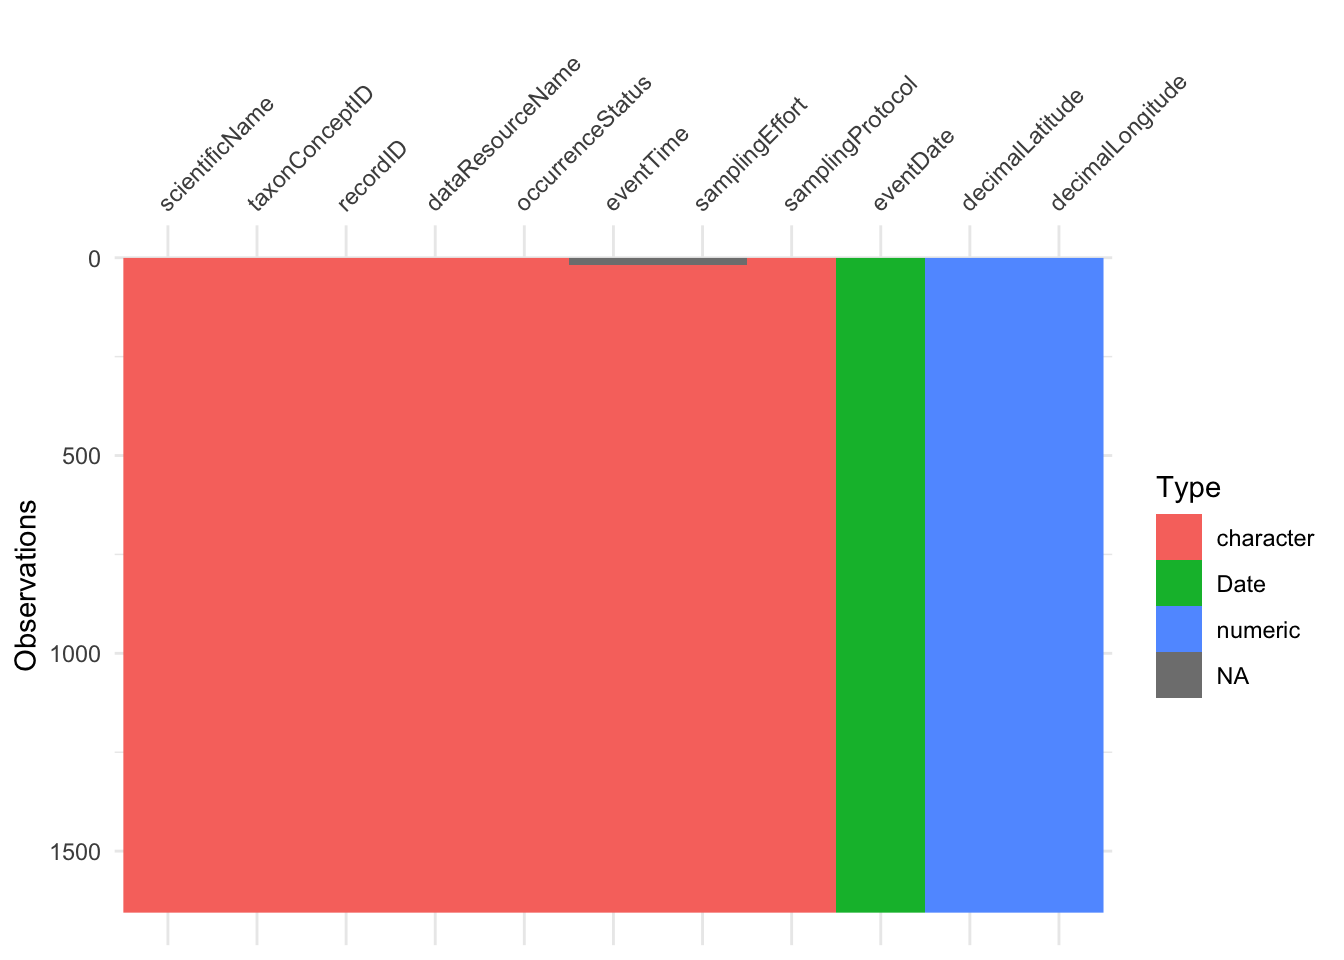
visdat function.
3.2 Weather data
Exploring the correlation between weather conditions and Woylie sightings can yield valuable insights into their behavior. To conduct this analysis, it would be useful to first identify the locations where Woylies are most frequently found and then obtain the weather data from the nearest weather stations.
The Global Historical Climatology Network (GHCN) database contains weather station data that are valuable for analysing trends in weather patterns and precipitation. This data can be obtained using the rnoaa package.
Utilising an interactive Leaflet map of Woylie sightings allows for the identification of the nearest weather stations to the clusters of Woylie sightings.
As demonstrated in Figure 3, the five closest weather stations are:
Weather Station ID: ASN00020028, which is closest to the Danggali Wilderness Protection area.
Weather Station ID: ASN00023373, which is closest to the Yookamura Private Nature Reserve.
Weather Station ID: ASN00018192, which is closest to the sightings near Port Lincoln at the Lincoln National Park.
Weather Station ID: ASN00076031, which is closest to the sightings at Mallee Cliffs National Park.
Weather Station ID: ASN00054038, located near the sightings at Pilliga East State Forest.
The highest number of Woylie sightings was recorded in Pilliga East State Forest, and as a result, the weather data to be obtained will be from the nearest weather station, which is the Narrabri Airport weather station.
This weather data can then be merged with Woylie observation data to create a comprehensive dataset for use in Section 4.2.
4 Exploratory data analysis
4.1 Exploration of Woylie Sightings against intial expectations
In this section, we will delve into the exploratory data analysis of Woylie sightings, focusing on verifying our expectations through data visualization and analysis. Furthermore, we will evaluate whether visual inference techniques support or contradict our initial assumptions.
Now, let’s move forward with exploring the data visually to acquire meaningful insights into the behavior and distribution of the Woylie.
4.1.1 Trend in Woylie Sightings
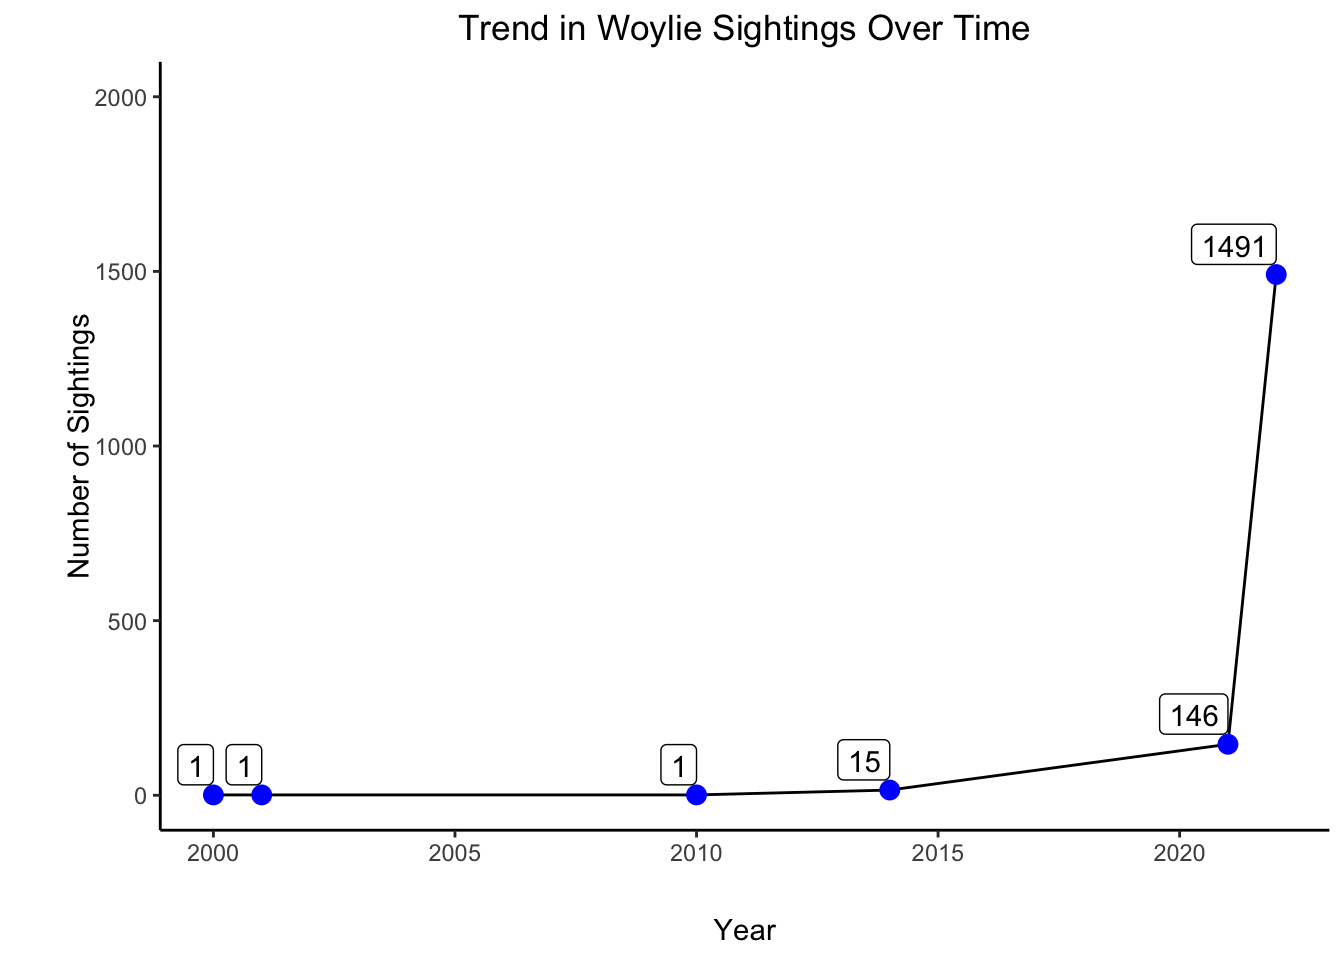
Figure 4 shows the trend in Woylie sightings over the years.
Key takeaway
We see that the actual trend is not aligning with our expectations, we see a relatively flat trend with minimal sightings from around 2000 up until approximately 2015 and a significant spike in sightings around 2020.
4.1.2 Geographical Distribution
The Leaflet map, initially featured in Section 3.2 and presented again in Figure 5, provides a clear geographic representation of Woylie sightings.
Woylies exhibit distinct habitat preferences across various regions in Australia, and these preferences are closely associated with five specific weather stations: Gluepot Reserve, Nuriootpa Viticultural, North Shields (Port Lincoln Airport), Mildura Airport, and Narrabri Airport. These weather stations correspond to the following National Parks: Danggali Wilderness Protection area, Yookamura Private Nature Reserve, Lincoln National Park, Mallee Cliffs National Park, and Pilliga East State Forest.
The map starkly highlights the significant reduction in Woylie populations, stemming from challenges related to habitat loss and disease. Notably, it demonstrates the success of the population relocation strategy, which aims to guide Woylies towards conservation areas. The majority of Woylie clusters are now concentrated within the National Parks, as shown on the map.
Moreover, the implementation of disease management programs is supported by evidence in Section 4.1.1, which indicates a recent upsurge in Woylie sightings in recent years. This increase can be attributed to the fact that these creatures are more readily observed within National Parks, further underscoring the effectiveness of this conservation approach.
4.2 Exploration of Woylie Sightings with Weather Data
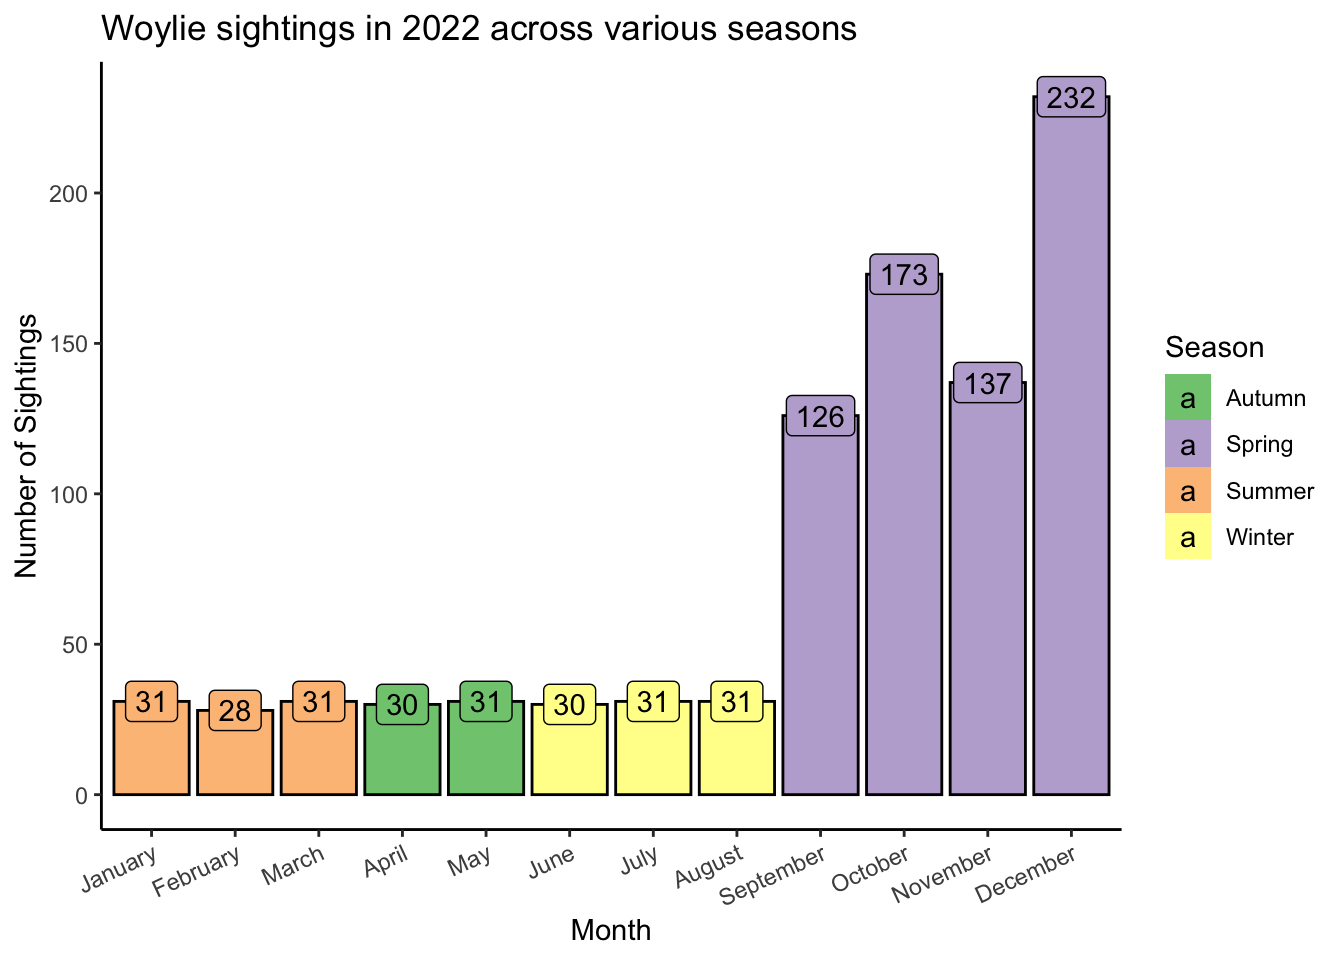
Figure 6 illustrates that the number of Woylie sightings varied throughout the year, but the highest number of sightings occurred in the spring season (between September to Deecem
The provided code filters the dataset to isolate Woylie sightings that occurred exclusively in the year 2022 and subsequently generates a bar chart to visualize the distribution of these sightings across different months.
The resulting bar chart shows that the number of Woylie sightings varied throughout the year, but the highest number of sightings occurred in the spring and summer months (October to March). The lowest number of sightings occurred in the winter months (April to September).
There are a few possible explanations for this pattern. One possibility is that Woylies are more active during the spring and summer months due to the warmer weather and longer days. Another possibility is that there is more food available for Woylies during the spring and summer months. Finally, it is also possible that Woylies are more visible during the spring and summer months because they are spending more time outside.
To delve into the connection between temperature and sightings, you have the option to craft scatter plots or line plots that unveil how temperature variables like ‘tmax’ or ‘tmin’ correlate with the observed number of sightings. Here’s an illustrative instance of crafting a plot:
Key takeaway
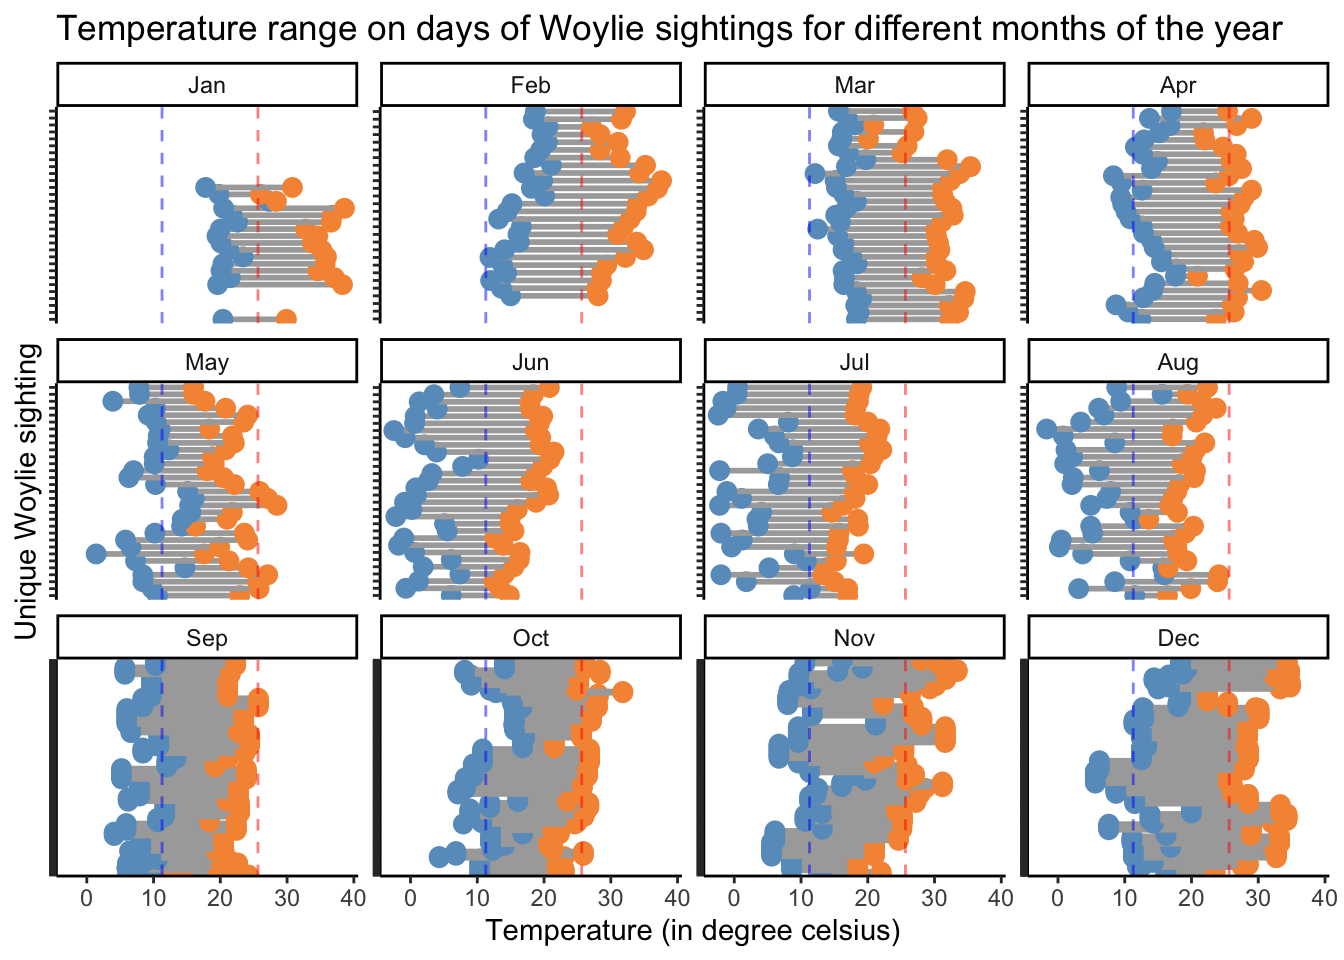
Upon analysing the maximum and minimum temperatures on the days of Woylie sightings as illustrated by Figure 7, we can obseve the following:
There appears to be lower number of Woylie sightings during the initial months of the year. The initial months in Australia constitute of the summer and is typically characterised by higher than average maximum and minimum temperatures. The low sightings during the summer suggests that the Woylies are not as active on warmer days.
Between the months of April to August, the number of Woylie sightings are observed to gradually rise. These months are relatively cold in Australia and appear to promote higher mobility among the Woylies.
There are distinctly higher number of observations from the month of September to December. This coincides with the Australian spring season. Based on the data, we can infer that the spring season appears to be the one promoting the highest activity among the Woylies.
5 Temporal analysis
For the purpose of performing a temporal analysis of the tourist patterns, we will be focusing on the tourist footfalls in the Narrabri region with the highest Woylie sightings.
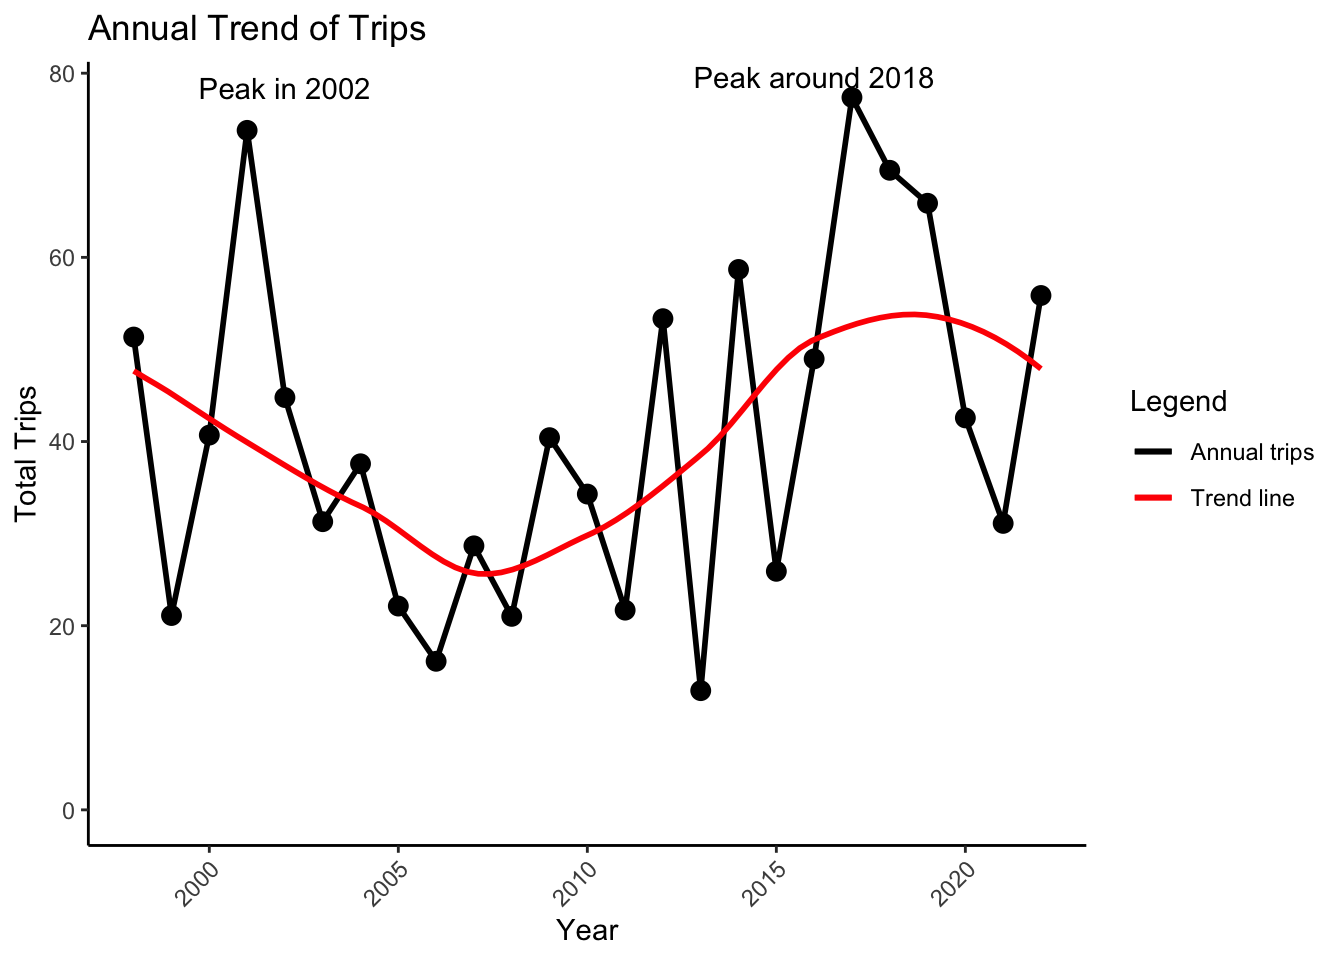
Figure 8 displays the annual trend of trips from 2000 to 2020, highlighting both the yearly fluctuations in the number of trips and the overarching trend across the years.
Key takeaway
There are two significant peaks in the data – one around 2002 and another around 2018. The trend suggests fluctuations in the total number of trips throughout the years.
Post-2018, there seems to be a decline in trips, but it recovers towards 2022.
Around the years 2005 and 2015, there are evident dips in the number of trips,thus the trips were considerably lower than their surrounding years.
The trend line indicates a cyclic nature of the trip volumes with peaks and troughs.
Figure 9 represents seasonal patterns from the years 1998-2022 in the Narrabbri Surrounds region
Key takeaway
The number of trips seems to be consistent throughout the earlier years ( 1998-2005), with no significant peaks or troughs across the quarters.
Q1: Generally, the colors for Q1 across the years seem to be on the lighter side compared to other quarters. This suggests that Q1 typically witnesses fewer trips. 1998-2005 shows a fairly consistent shade for Q1, indicating that the number of trips were fairly consistent during this period for Q1
Q2 : This quarter appears to have variable trip numbers without a consistent trend, the volume of trips seem similar to Q1 but with some years having higher number of trips
Q3 : Q3 consistently displays the darkest hues on the heatmap across multiple years, indicating that this quarter usually experiences the highest volume of trips when compared to the other quarters.
Q4 : This quarter appears to have variable trip numbers without a consistent trend. Some years in the early and mid-2010s display darker shades, indicating increased travel activity during that time
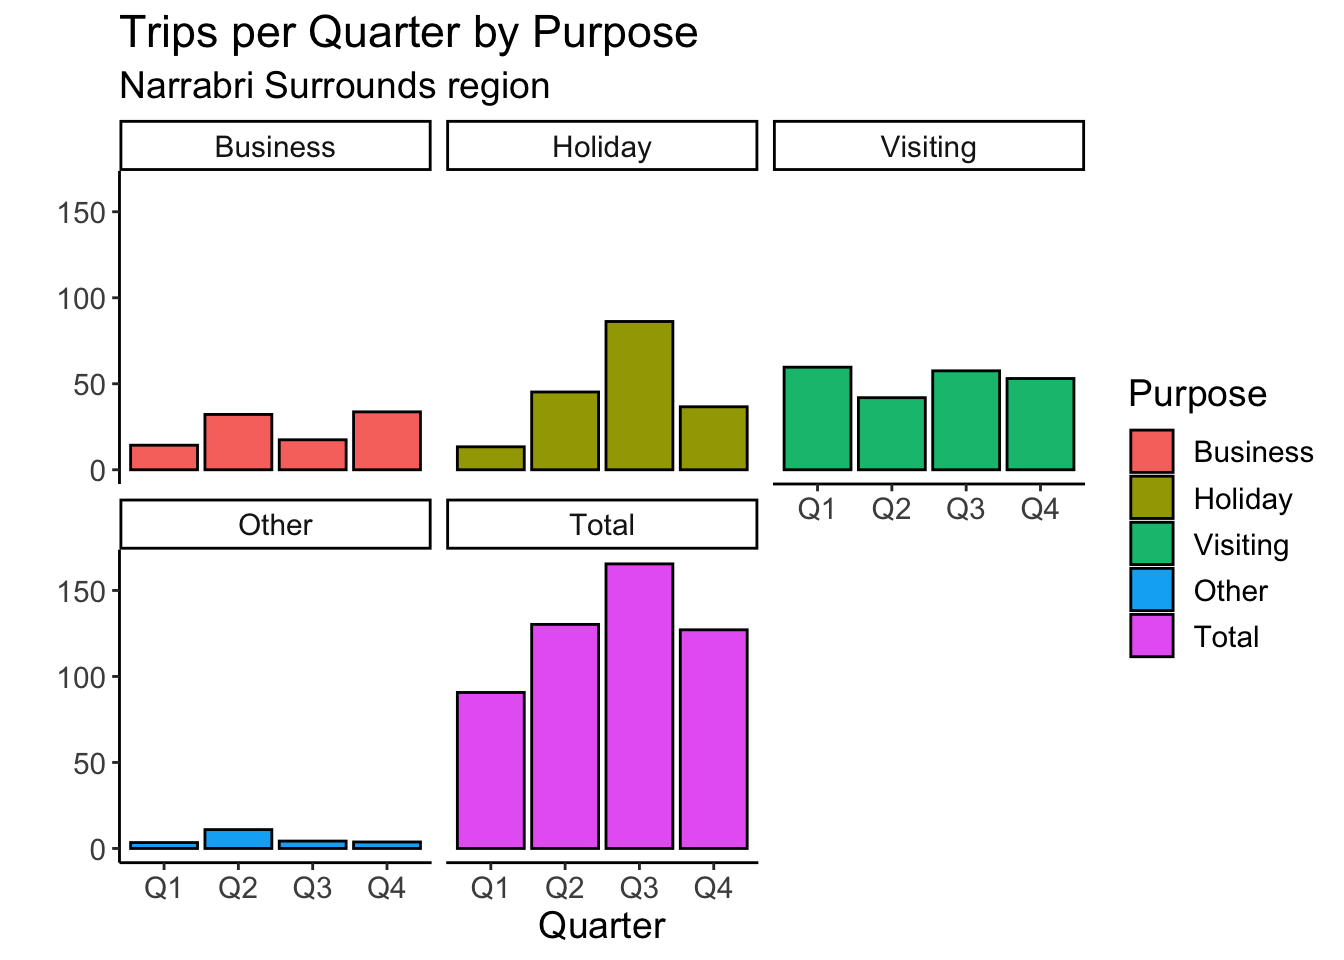
Figure 10 shows distribution of trips made in the Narrabri Surrounds region, broken down by their primary purpose - Business, Holiday, Visiting, Other, and Total.
Key takeaway
Business trips are least frequent in the first quarter and peak in Q2 and Q4. This could imply end-of-year meetings, reviews, or projects that drive increased business travel.
Visiting-related trips maintain a fairly consistent number throughout the year, suggesting that family or friend visits are evenly spread and not particularly influenced by the season.
Holiday trips gradually increase from Q1 to Q2 and surge in Q3. There’s a decline in Q4, but it still remains higher than Q1, suggesting an interest in holidays during the latter part of the year.
Overall, The third quarter (Q3) is the most active period, suggesting factors or events in these months (July to September) that drive an increase in the number of trips. There is a clear progression of activity from Q1 to Q3, starting with the lowest activity in Q1 and gradually increasing to reach its pinnacle in Q3.
Among the specific purposes, “Visiting” trips dominate, followed by “Holiday” trips. “Business” and “Other” have a relatively lower volume of trips, with “Business” trips being the least common.
Figure 11 illustrates the pattern of trips for various purposes in the Narrabri region, while Figure 12 provides us with an understanding of the relative trend strength and seasonality of the data related to various trip purposes.
Key takeaway
There is a distinct pattern in the number of trips for each of the purposes (Business, Holiday, Other, and Visiting) when analysing the tourism data for the Narrabri region.
There have been significant periods of time in this region with very low business trips. However, recently, business trips have become more frequent and in higher numbers.
As expected, typical of many holiday trends, a noticeable seasonality in holiday trips for the Narrabri region becomes apparent. This is further substantiated by the intermediate seasonal strength of around 0.4 observed in Figure 12.
Additionally, there seems to be low seasonality in trips related to business, visits, and ‘other’ purposes. This suggests that the patterns of trips in the region for these purposes do not exhibit regular intervals.
However, there is a moderate trend strength in the overall total trips as well as in visit-related trips, based on the analysis in Figure 12. This indicates that the total trips due to visits and the overall total trips in the region have increased over time, particularly in recent years.
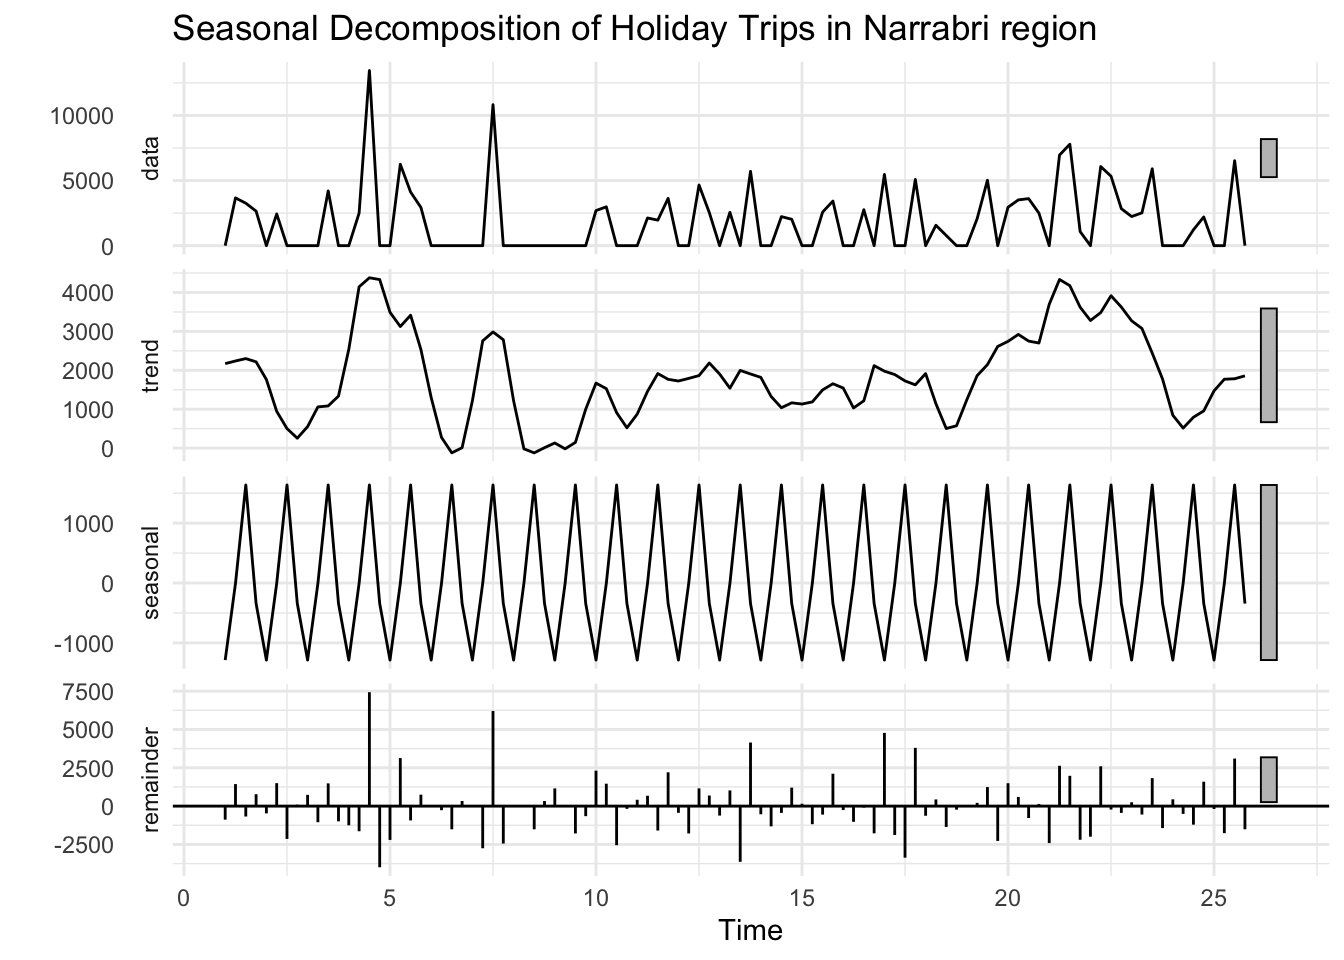
Figure 13 illustrates the seasonal decomposition of the total trips over the years in the Narrabri region. The resulting plot will typically include four components:
Original Time Series: The actual data points.
Trend Component: This represents the long-term trend in the data.
Seasonal Component: This represents the seasonal pattern or periodic fluctuations.
Residual Component: This is the part of the data that is not explained by the trend or seasonal components.
Key takeaways
The holiday data shows that the seasonality has been more consistent in the recent years when compared to the initial years of the data.
The trend of the holiday data does not show a clear rise or fall of trips in the Narrabri region. The total trips are observed to vary around approximately 2000 trips every quarter.
The recent rise in the seasonality of the holiday trips for the Narrabri regions could attributed to the annual 45km Tour de Gorge bike ride through the Pilliga Nature Reserve which first started in the year 2013.
6 Ecotourism
Ecotourism involves traveling to places in support of the conservation efforts of endangered wildlife. To assess the level of interest in ecotourism for the Woylie, an analysis that combines tourism data from Tourism Research Australia (TRA) and Woylie sightings near the weather station of interest, Narrabri Airport, as reported in Section 3.2, will provide us with a holistic view. To ensure a more accurate matching of the data with tourism data, the observations of the Woylie are subsetted to focus on the Australian Statistical Area Level 2 (SA2) region: Narrabri Surrounds.
6.1 Tourism trend in Narrabri Surrounds
The tourism data will be filtered for the region of Narrabri Surrounds as part of the analysis. The purpose of tourism trips will also be filtered to holiday trips since this suggests the intention to travel for sightseeing and exploration. Other purposes, such as visiting friends and relatives or business, may include visiting the endangered Woylie species during the trip, but the purposes are too broad to draw conclusive insights. Therefore, choosing holiday tourism data will result in the most accurate analysis.
Key takeaway
Based on the initial analysis of Figure 14, the following observations can be made:
- The number of trips designated as “holiday” is irregular, with several quarters and years showing no holiday visitors in the region of interest. However, after 2008, trips become more frequent.
- Consequently, there is only a moderate seasonality in holiday visits in this region.
- The highest number of holiday visitors was recorded in the 3rd quarter of 2001, with nearly 13,445 visits.
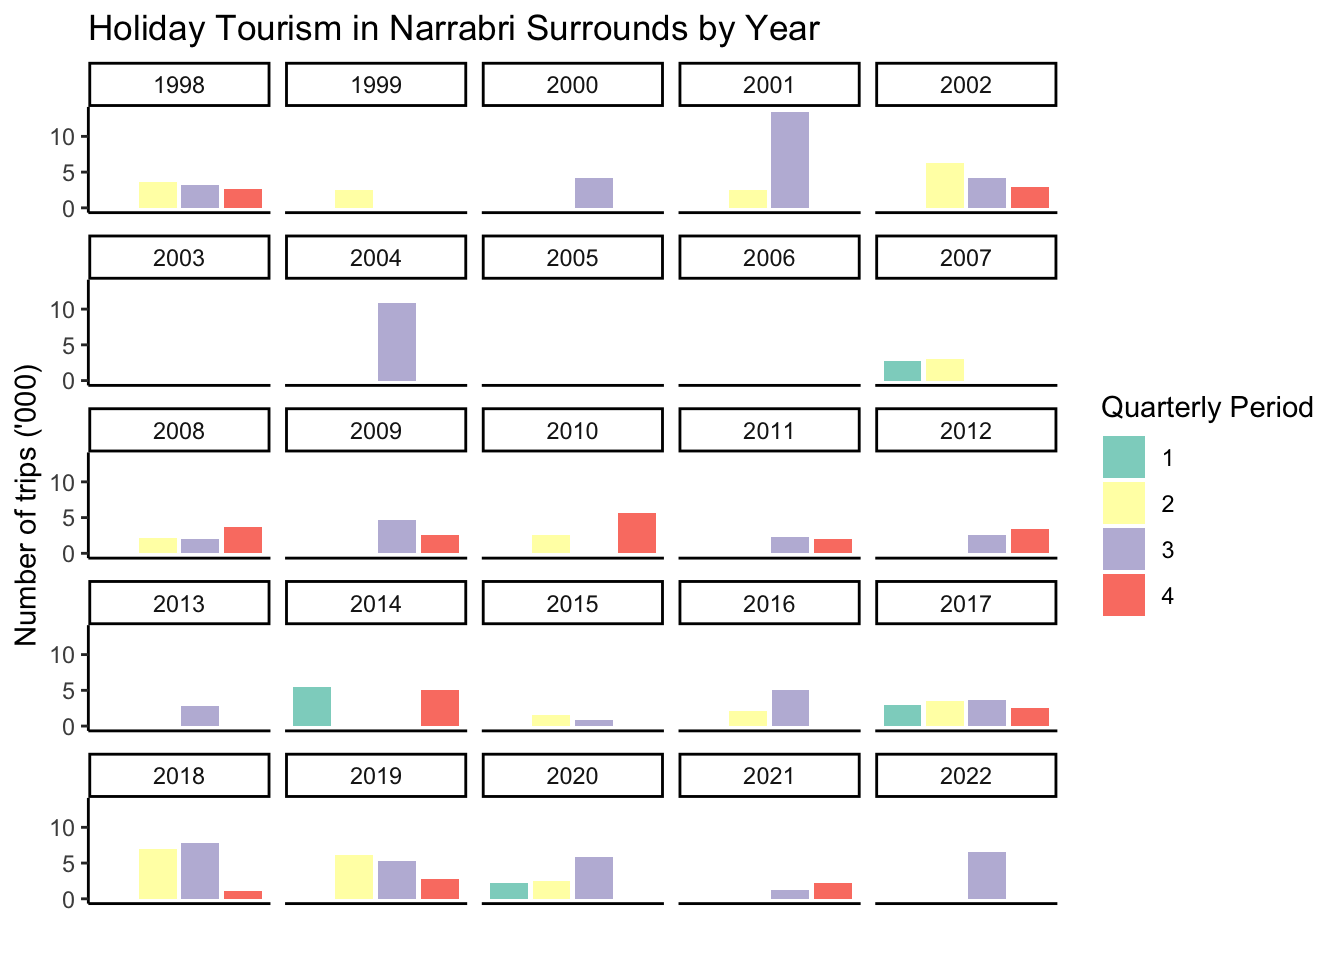
Similar to Figure 14, Figure 15 presents holiday tourism in a year calendar format to visualise and observe the annual tourism trend. The data reveals increased tourism frequency after 2008.
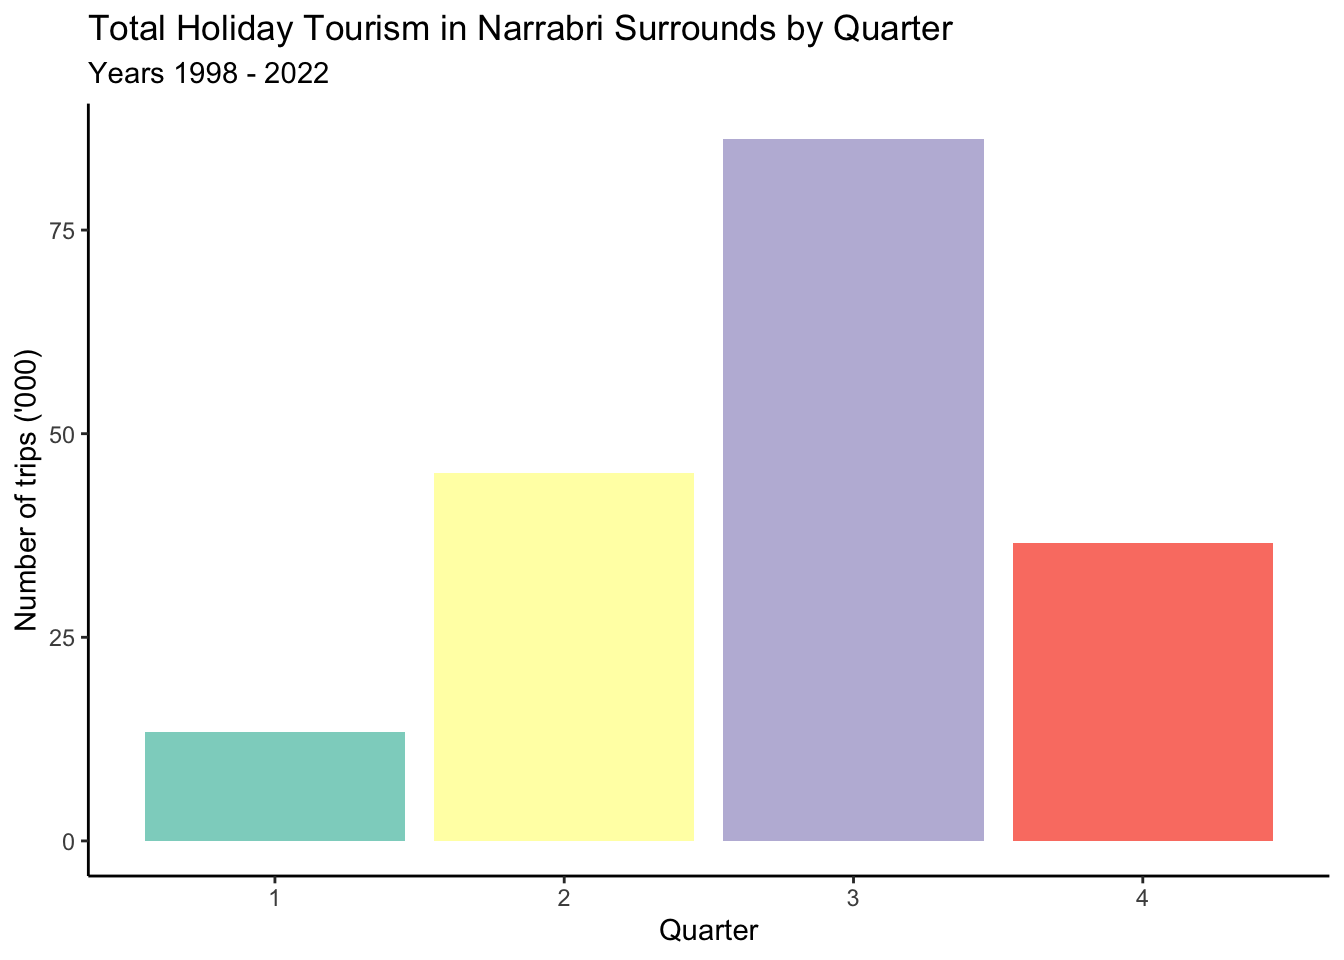
When grouping the tourism visit numbers in Narrabri Surrounds by quarter, Quarter 1 experiences the fewest tourists compared to Quarter 3, which receives the most, as can be seen in Figure 16. Specifically, from January to March, Narrabri Surrounds sees the least tourism, while from July to September, the area has the most tourism.
6.2 Species Sightings
The examination of the number of visitors in the Narrabri Surrounds region for holiday purposes has now laid the foundation for an exploration of wildlife sightings and visitation trends, allowing for the investigation of potential correlations.
Below, an analysis of Woylie sightings with visitor trends in the Narrabri Surrounds region is conducted.
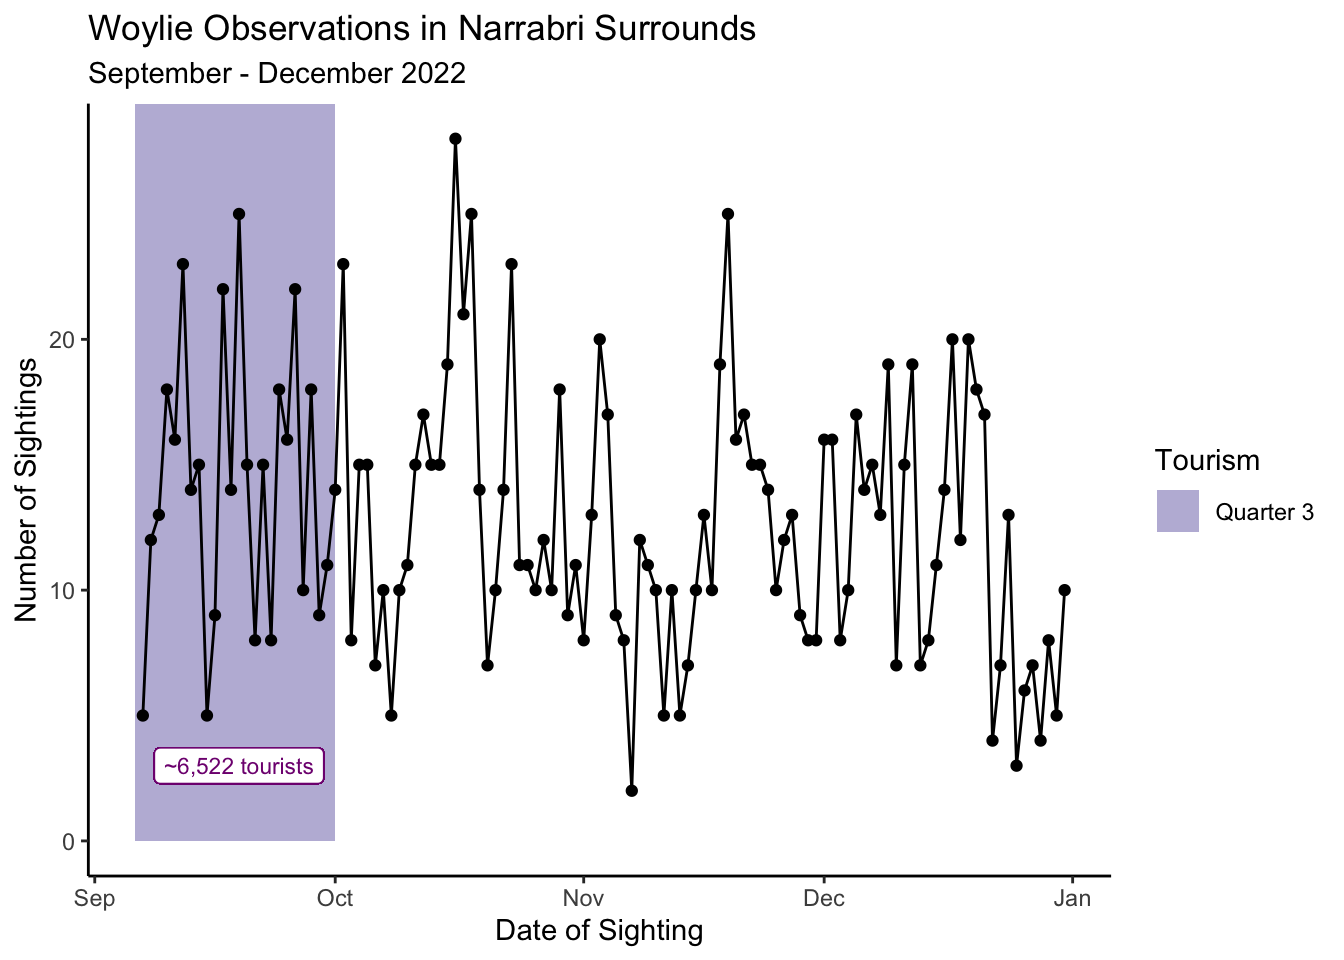
Figure 17 displays the sightings that occurred in Quarters 3 and 4 of 2022. This recent, short surge in observations is too brief to correspond with the tourism data. This is evident from the highlighted quarter. It was the only quarter where trips involving over a thousand people occurred, which is also noticeable in the last calendar plot in Figure 15.
Key takeaways
Based on the analysis of Figure 17, the following key observations can be made:
- While the Narrabri region was found to have the highest Woylie sightings in Australia, this was not always the case.
- According to the sightings data from the Atlas of Living Australia, Woylie sightings in the Narrabri region were exclusively in the 3rd and 4th quarters of 2022.
- Recognising this unique trend in the data, a more in-depth analysis was conducted to identify the underlying cause of this skewed pattern.
- According to a detailed report by the Australian wildlife organisation, Woylies, being an endangered species, are now inhabiting the protected Pilliga East Forest reserve, located in the Narrabri SA2 region.
- A significant number of Woylies were transferred from Western Australia to New South Wales (including the Narrabri region) in 2022, with the purpose of providing a safe environment for breeding and conservation efforts.
- The special conservation initiatives undertaken by the Australian wildlife organisation, as mentioned in the points above, are expected to contribute to the high number of Woylie sightings in the year 2022.
Overall, there is a limited relation between these two sets of data. It is evident that tourism in the Narrabri Surrounds area exhibits significant inconsistency and year-to-year variation. The peak in Woylie observations in Narrabri Surrounds toward the end of 2022 can be attributed to conservation efforts for this endangered species, resulting in a notable increase in sightings. However, the lack of alignment between these two time periods hinders further analysis. This suggests that tourism in the area may not be strongly linked to Woylie sightings, ultimately yielding an inconclusive result in terms of ecotourism.
In general, an internet search for terms such as “Pilliga State Conservation Area,” “Pilliga National Park”, “Woylie,” and “Narrabri Surrounds,” or a combination of these terms, yields minimal results related to marketing efforts promoting visits to the area for Woylie sightings.
This aligns with our findings, indicating that there is little to no ecotourism activity in this area for this particular species.
7 Summary
In summary, our thorough exploration of Woylie (Brush-Tailed Bettong) sightings in Australia has unveiled crucial insights into the behavior, distribution, and population trends of this critically endangered species. Our findings hold significant implications for the conservation of Woylies and provide valuable guidance for future endeavors.
Key Observations
Trend in Woylie Sightings: Our analysis has illuminated a discernible trend in Woylie sightings over time. This trend analysis offers invaluable insights into the dynamics of Woylie populations, highlighting whether their numbers are on the rise, in decline, or holding steady.
Seasonal Patterns: Our investigation into seasonal patterns of Woylie sightings has revealed distinct trends. These patterns shed light on the species’ breeding behaviors and responses to climatic fluctuations, enhancing our comprehension of their life cycles.
Geographical Distribution: An examination of geographical distribution has pinpointed specific regions with varying degrees of Woylie sightings. These findings are instrumental in assessing habitat preferences and delineating priorities for conservation efforts.
Conservation Significance
Our findings carry significant implications for the conservation of Woylies. They underscore the importance of implementing conservation strategies, including safeguarding their habitats, curbing the impact of invasive species, and effectively managing diseases that affect these marsupials.
Limitations
It is imperative to acknowledge the constraints and limitations encountered during our analysis which have been delineated as follows:
The observations for the Woylie sightings were observed to be extremely skewed towards the year 2022 for the Narrabri region. As a result, the insights generated were for a brief period of time and require more data for further meaningful analysis.
The tourism data with respect to the Narrabri Surrounds region for the year of 2022 was observed to be extremely limited. The poor quality and availability of the data was observed to pose further challenges so as to ascertain any significant correlation between the tourim and sighting trends.
Suggestions
While performing a detailed analysis of the Woylie sightings, the data quality was observed to be poor with multiple missing values. The reporting authorities can take note of the challenges faced while performing a detailed analysis with incomplete data.
Multiple observations have been recorded after long periods of time. While this may indicate the elusive behaviour of the Woylies, it is unclear whether this is contributed by the irregular recording of data. Hence, a key suggestion to aid detailed and accurate analyses would be to furnish complete data at regular intervals.
Future Directions
To further advance our understanding of Woylie behavior and conservation, future research avenues could encompass expanded data collection, enhanced monitoring techniques, and comprehensive studies of habitat quality.
8 Conclusion
In conclusion, our exploratory data analysis offers valuable insights into Woylie sightings in Australia. Understanding population trends, seasonal patterns, and geographical distribution is pivotal for the conservation of this unique marsupial. Our findings can guide conservationists, researchers, and policymakers in making informed decisions and taking actions to safeguard the future of Woylies in their natural habitat.
We emphasize the importance of ongoing monitoring and research to ensure the long-term survival of this iconic and critically endangered Australian species.
9 References
9.1 Websites
- WWF Australia. (2021). Census Results Show West Australian Woylies Are Ready for Big Move to South Australia. Retrieved from https://wwf.org.au/news/2021/census-results-show-west-australian-woylies-are-ready-for-big-move-to-south-australia/
- Department of Biodiversity, Conservation and Attractions, Western Australia. (n.d.). Recovery plan for the Woylie (Bettongia penicillata ogilbyi) 2019-2023. Retrieved from https://library.dbca.wa.gov.au/static/FullTextFiles/071861.pdf
- Australian Wildlife Conservancy. (n.d.). Woylie - Brush-tailed Bettong. Retrieved from https://www.australianwildlife.org/wildlife/woylie-brush-tailed-bettong/
- Jones, M. E., & Benshemesh, J. (2013). The Woylie: Australia’s Forgotten Future. The Conversation. Retrieved from https://theconversation.com/australian-endangered-species-woylie-19448
- Museum of Western Australia. (n.d.). Woylie. Retrieved from https://visit.museum.wa.gov.au/boolabardip/woylie#:~:text=Now%2C%20they%20can%20only%20be,to%20a%20few%20fenced%20reserves.
- Australia Your Way. (n.d.). When to Visit NSW. Retrieved from https://australiayourway.com/when-to-visit-nsw/
9.2 Packages
- broom: Robinson D, Hayes A, Couch S (2023). broom: Convert Statistical Objects into Tidy Tibbles. R package version 1.0.5, https://CRAN.R-project.org/package=broom.
- forecast: Hyndman R, Athanasopoulos G, Bergmeir C, Caceres G, Chhay L, O’Hara-Wild M, Petropoulos F, Razbash S, Wang E, Yasmeen F (2023). forecast: Forecasting functions for time series and linear models. R package version 8.21, https://pkg.robjhyndman.com/forecast/. Hyndman RJ, Khandakar Y (2008). “Automatic time series forecasting: the forecast package for R.” Journal of Statistical Software, 26(3), 1-22. doi:10.18637/jss.v027.i03 https://doi.org/10.18637/jss.v027.i03.
- galah: Westgate M, Kellie D, Stevenson M, Newman P (2023). galah: Biodiversity Data from the Living Atlas Community. R package version 1.5.3, https://CRAN.R-project.org/package=galah.
- GGally: Schloerke B, Cook D, Larmarange J, Briatte F, Marbach M, Thoen E, Elberg A, Crowley J (2021). GGally: Extension to ‘ggplot2’. R package version 2.1.2, https://CRAN.R-project.org/package=GGally.
- ggalt: Rudis B, Bolker B, Schulz J (2017). ggalt: Extra Coordinate Systems, ‘Geoms’, Statistical Transformations, Scales and Fonts for ‘ggplot2’. R package version 0.4.0, https://CRAN.R-project.org/package=ggalt.
- ggplot2: H. Wickham. ggplot2: Elegant Graphics for Data Analysis. Springer-Verlag New York, 2016.
- leaflet: Cheng J, Schloerke B, Karambelkar B, Xie Y (2023). leaflet: Create Interactive Web Maps with the JavaScript ‘Leaflet’ Library. R package version 2.2.0, https://CRAN.R-project.org/package=leaflet.
- lubridate: Garrett Grolemund, Hadley Wickham (2011). Dates and Times Made Easy with lubridate. Journal of Statistical Software, 40(3), 1-25. URL https://www.jstatsoft.org/v40/i03/.
- nullabor: Buja, A., Cook, D., Hofmann, H., Lawrence, M., Lee, E.-K., Swayne, D. F, Wickham, H. (2009) Statistical Inference for Exploratory Data Analysis and Model Diagnostics Royal Society Philosophical Transactions A, 367(1906):4361-4383. URL http://rsta.royalsocietypublishing.org/content/367/1906/4361.article-info
- plotly: C. Sievert. Interactive Web-Based Data Visualization with R, plotly, and shiny. Chapman and Hall/CRC Florida, 2020.
- rmapshaper: Teucher A, Russell K (2023). rmapshaper: Client for ‘mapshaper’ for ‘Geospatial’ Operations. R package version 0.5.0, https://CRAN.R-project.org/package=rmapshaper.
- rnoaa: Chamberlain S, Hocking D (2023). rnoaa: ‘NOAA’ Weather Data from R. R package version 1.4.0, https://CRAN.R-project.org/package=rnoaa.
- sf: Pebesma, E., & Bivand, R. (2023). Spatial Data Science: With Applications in R. Chapman and Hall/CRC. https://doi.org/10.1201/9780429459016 Pebesma, E., 2018. Simple Features for R: Standardized Support for Spatial Vector Data. The R Journal 10 (1), 439-446, https://doi.org/10.32614/RJ-2018-009
- spatstat: Baddeley A, Rubak E, Turner R (2015). Spatial Point Patterns: Methodology and Applications with R. Chapman and Hall/CRC Press, London. ISBN 9781482210200, https://www.routledge.com/Spatial-Point-Patterns-Methodology-and-Applications-with-R/Baddeley-Rubak-Turner/p/book/9781482210200/.
- tidyverse: Wickham H, Averick M, Bryan J, Chang W, McGowan LD, François R, Grolemund G, Hayes A, Henry L, Hester J, Kuhn M, Pedersen TL, Miller E, Bache SM, Müller K, Ooms J, Robinson D, Seidel DP, Spinu V, Takahashi K, Vaughan D, Wilke C, Woo K, Yutani H (2019). “Welcome to the tidyverse.” Journal of Open Source Software, 4(43), 1686. doi:10.21105/joss.01686 https://doi.org/10.21105/joss.01686.
- tsibble: Wang, E, D Cook, and RJ Hyndman (2020). A new tidy data structure to support exploration and modeling of temporal data, Journal of Computational and Graphical Statistics, 29:3, 466-478, doi:10.1080/10618600.2019.1695624.
10 Acknowledgments
We extend our gratitude to the Atlas of Living Australia (ALA) for providing access to the Woylie occurrence records that underpin this analysis. Additionally, we appreciate the invaluable conservation efforts undertaken by organizations and individuals dedicated to preserving the Woylie and its fragile ecosystem.