How do the goals scored and conceded vary for those at the top and bottom of the table in Women’s EFL? ⚽️
R
data cleaning
exploratory data analysis
plot aesthetics
ggplot2
Observing variations of LGBTQ+ movies scores across languages
R
data cleaning
exploratory data analysis
plot aesthetics
ggplot2
Lifecycle of Steel: From Extraction to Recycling
R
data cleaning
exploratory data analysis
funnel charts
plot aesthetics
Unlocking Insights: Navigating High-Dimensional Data Analysis for Actionable Intelligence
R
data cleaning
exploratory data analysis
high dimensional data visualisation
model metrics
principal decomposition
non-linear decomposition
🤔🕵🏻♀️ Simplifying the Scene: Streamlining Visualization Plots for Clarity 📊
data cleaning
exploratory data analysis
visualisation
line plots
annotations
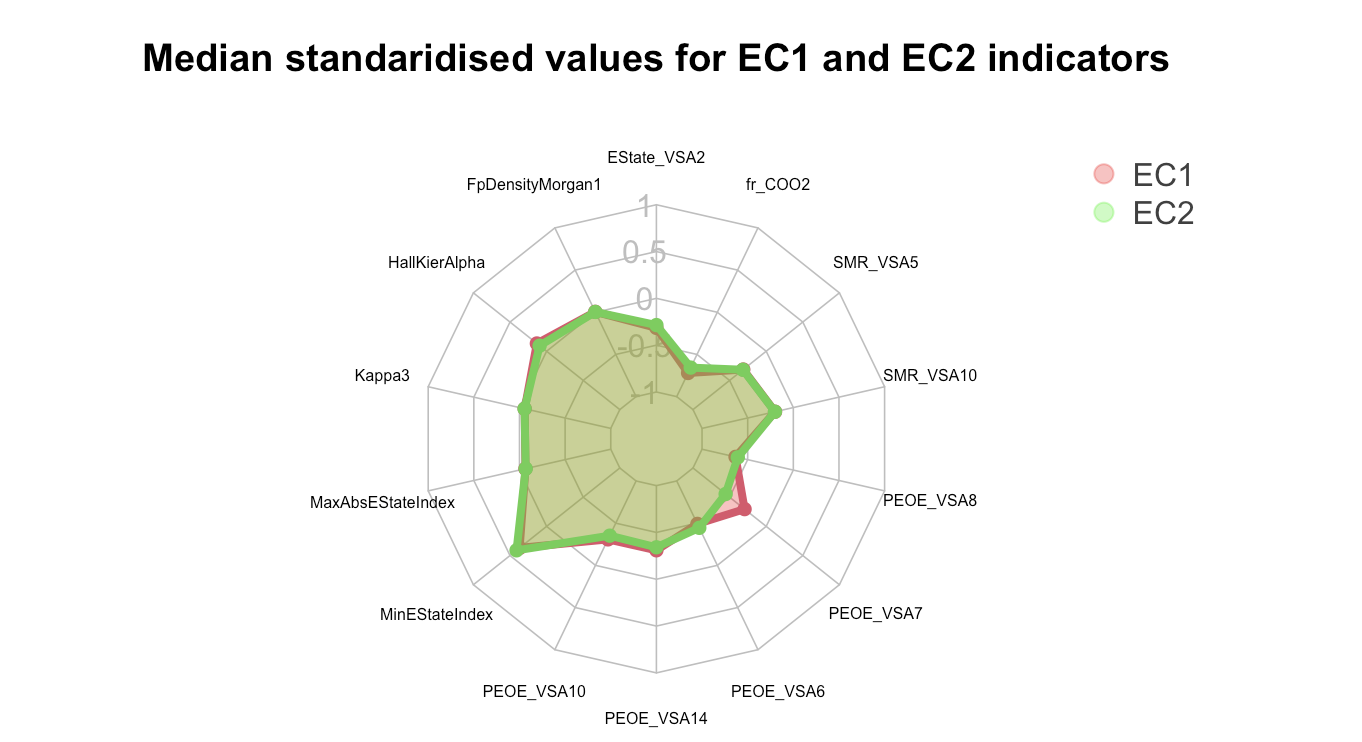
Utilisation of layered radar plots to understand how two entities differ from one another 🕸️🕵️♂️
data cleaning
exploratory data analysis
visualisation
radar plot
Crisp visualisations : Unveiling Data Dynamics with PowerBI 📊🧑💻
PowerBI
scatter plot
line plot
dashboards
annotations
Annotated and high contrast plots 📊💡
analysis
scatter plot
line plot
high contrast
annotations
No matching items


